Welcome to another crypto market outlook for the 8th of December!
BTC is not giving up that $100,000 easily, as the bulls and bears are fighting like never before with no clear winner yet. ETH is also around a strong resistance level and the round number of $4,000, making the upcoming week interesting.
Today, we will cover the following topics:
– Market Heatmap and Fear and Greed Index
– US500, DXY and Gold Analysis
– USDT.D, Bitcoin and Ethereum Analysis
– Quotes / Advices
– Closing Remarks
Market Heatmap and Fear and Greed Index
After celebrating the $100,000 milestone, BTC volatility has increased but is still hovering within a tight range. This ranging market for BTC and ETH has influenced many altcoins, with some following suit, while others have taken the opportunity to pump.
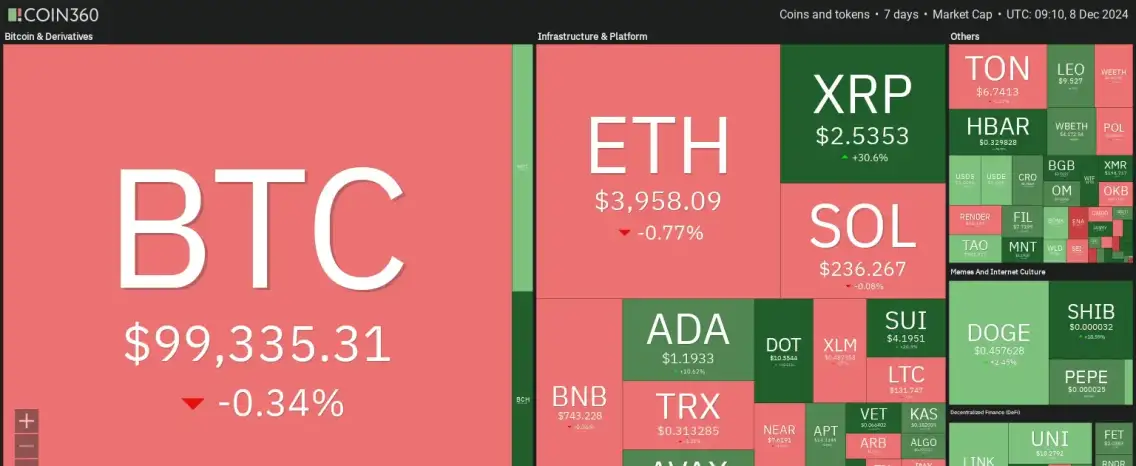
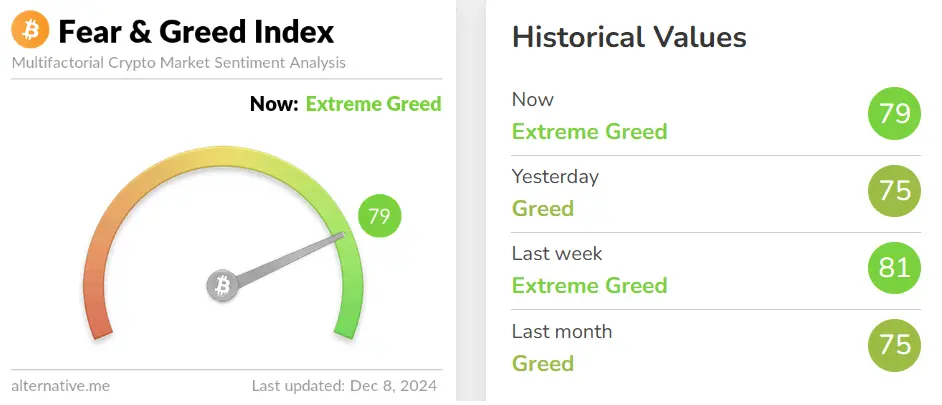
Today, the market sentiment is back to “Extreme Greed,” which is a signal for micro-cap altcoins to pump. However, if BTC and ETH start dipping hard, everything will likely follow.
US500, DXY and Gold analysis
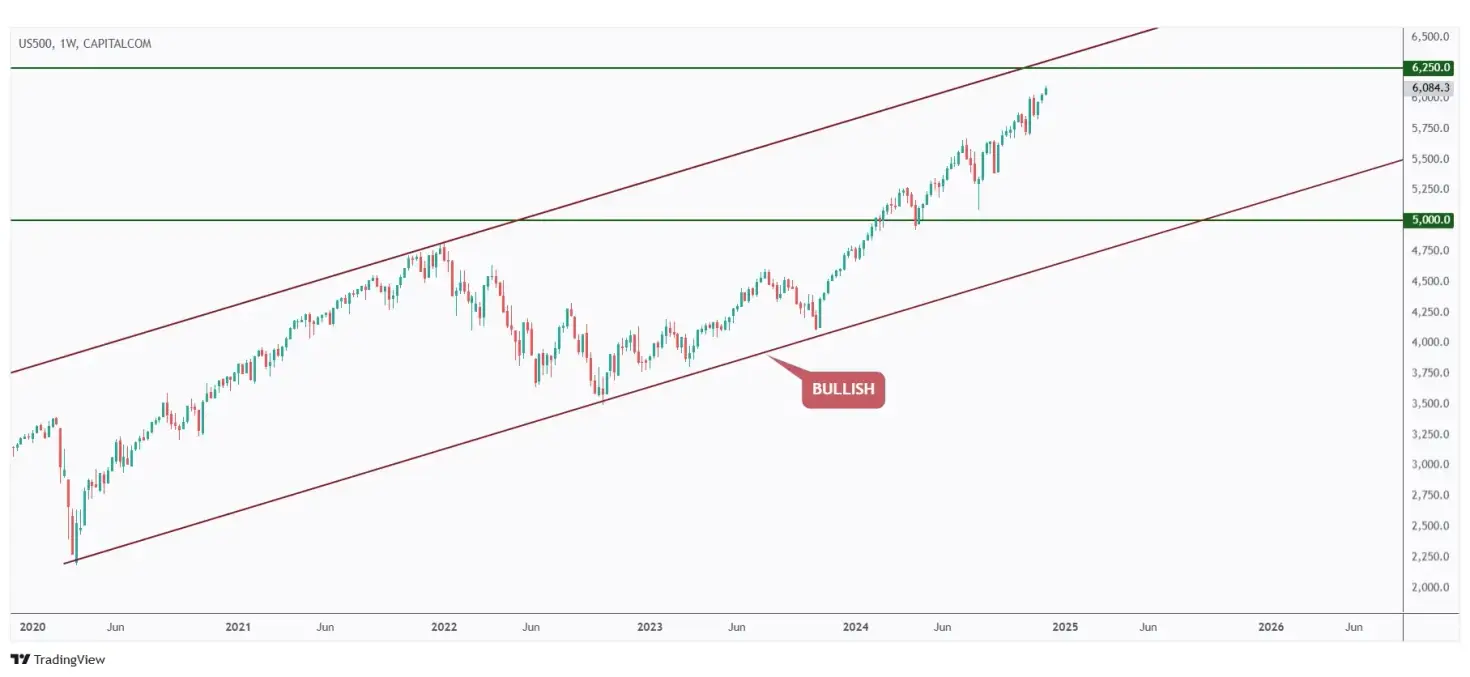
US500 doesn’t seem to pause its parabolic bullish movement just yet!
As mentioned in our last detailed market overview, the higher it climbs, the closer it approaches the upper bound of the channel, which might act as an overbought zone.
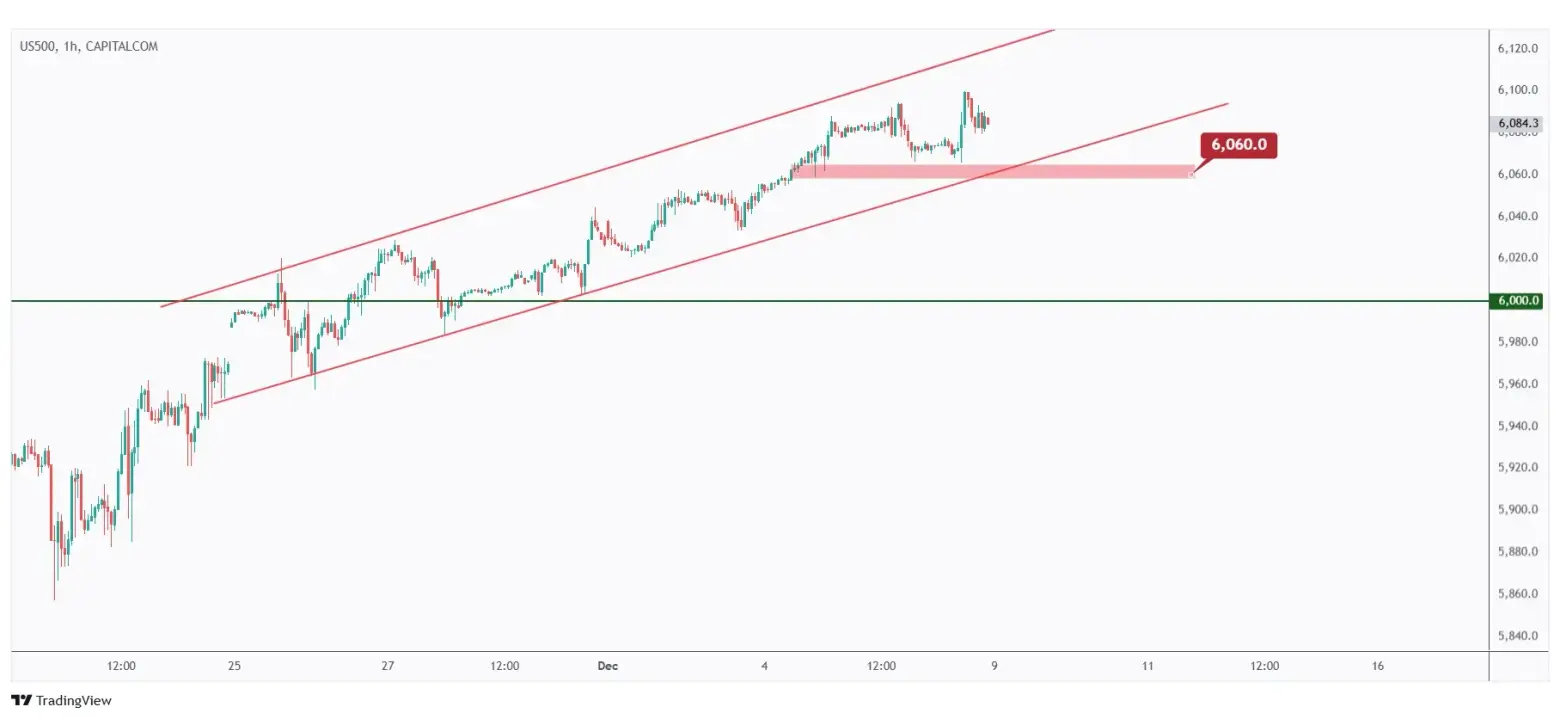
From a short-term perspective, the bullish trend is expected to persist unless the rising red channel and the $6,060 low are broken to the downside.

No clear update for DXY, as it is still hovering around the upper bound of its range, as mentioned in our last DXY analysis.
As long as the upper bound of the range holds, the bears are expected to kick in at any time.
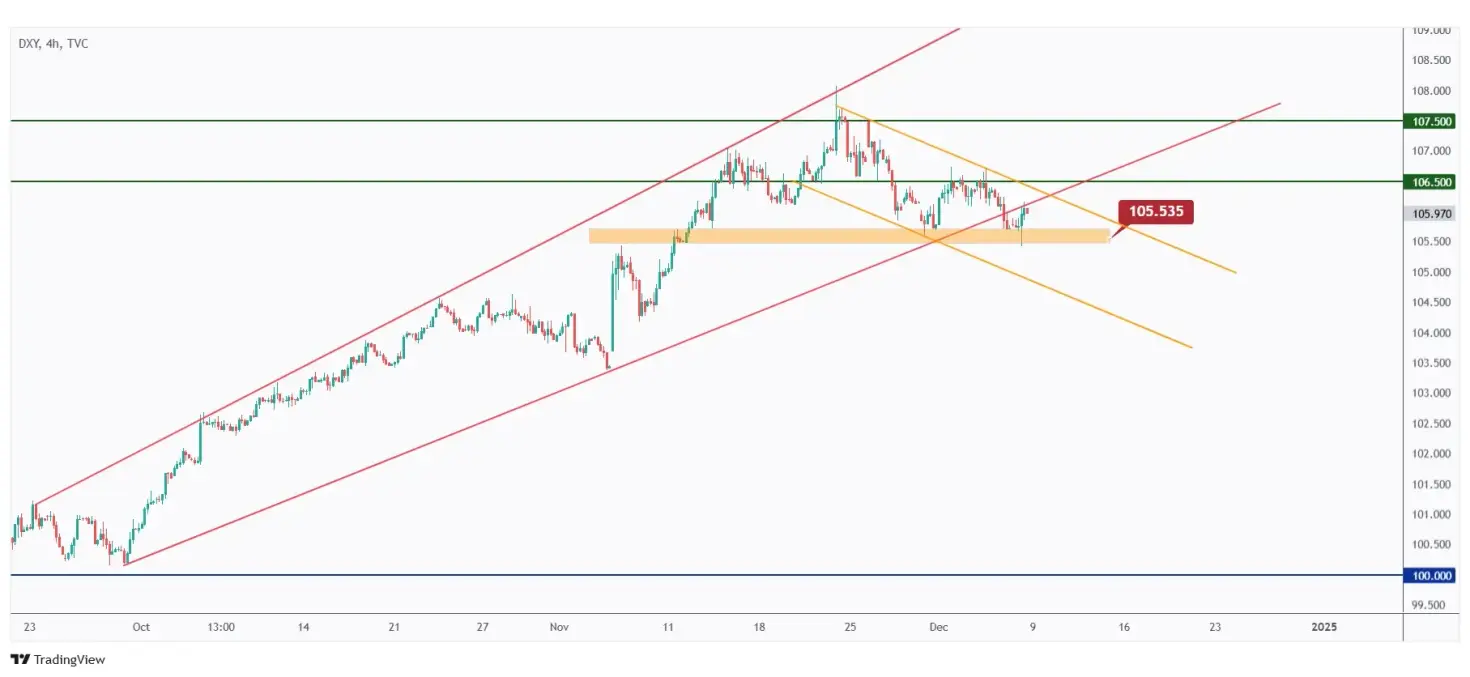
In the short term, the DXY has been bearish, trading within the descending orange channel.
For this bearish trend to extend into the medium term, a break below the $105.535 low is necessary.
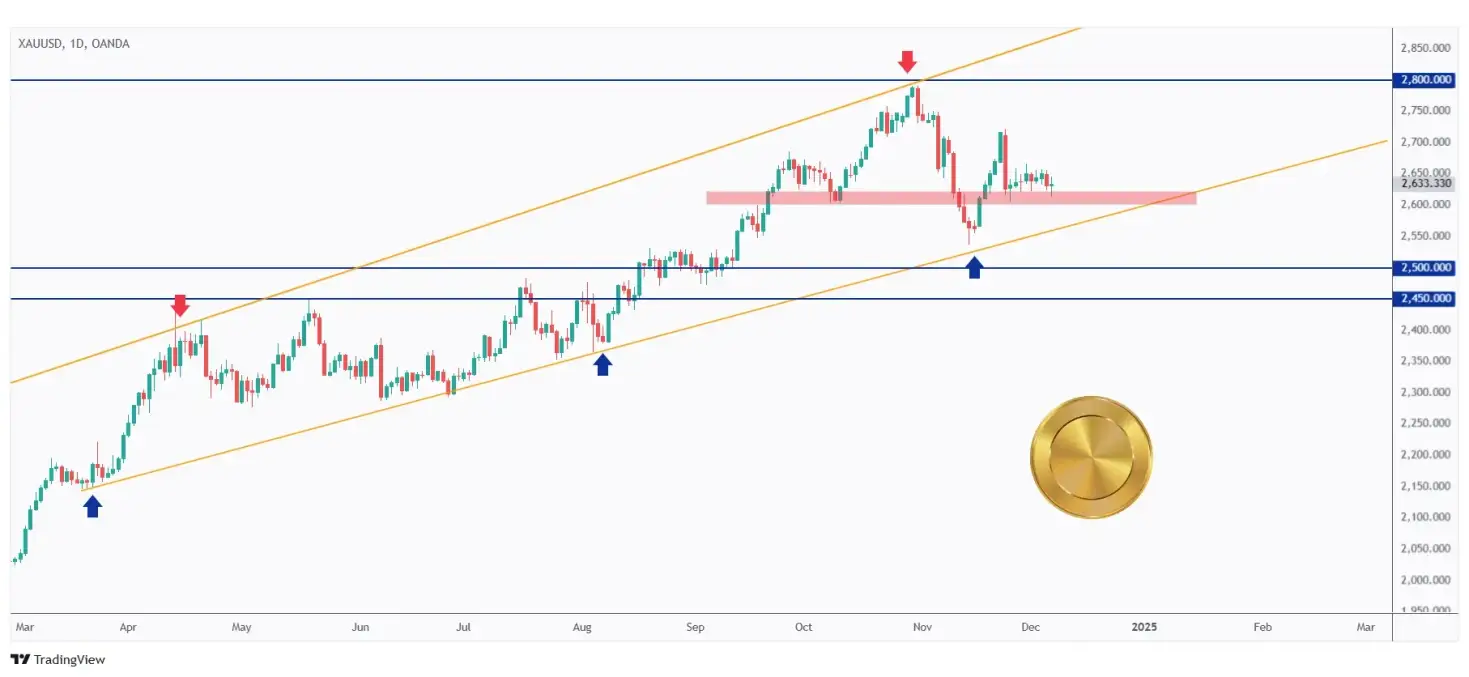
Gold is mimicking DXY volatility, as it has been forming a narrow range around the red structure.
As long as the red zone holds, bullish continuation is expected toward the $2,700 mark.
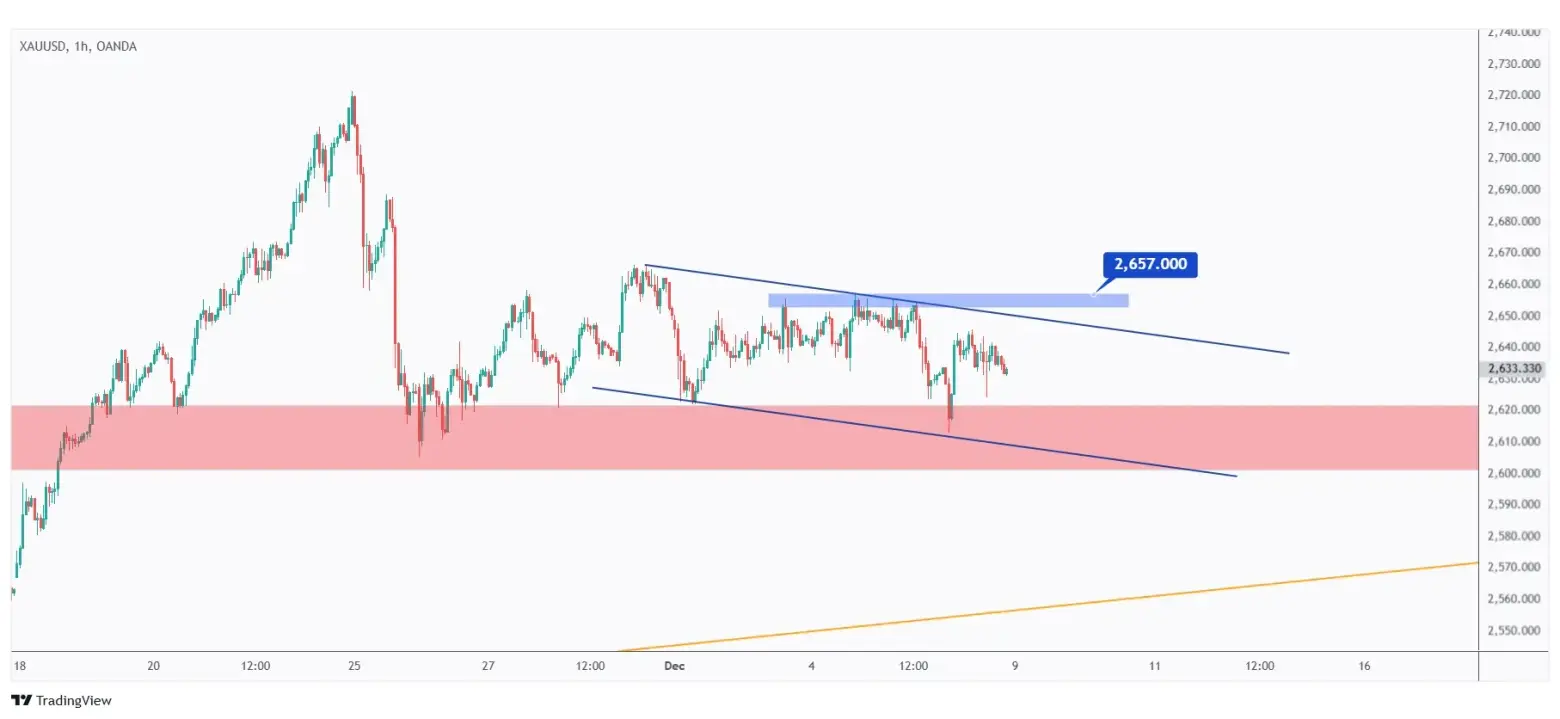
For the bullish continuation on the higher timeframe to start, a break above the short-term channel marked in red and the major high at $2,657 is needed.
USDT.D, Bitcoin and Ethereum analysis
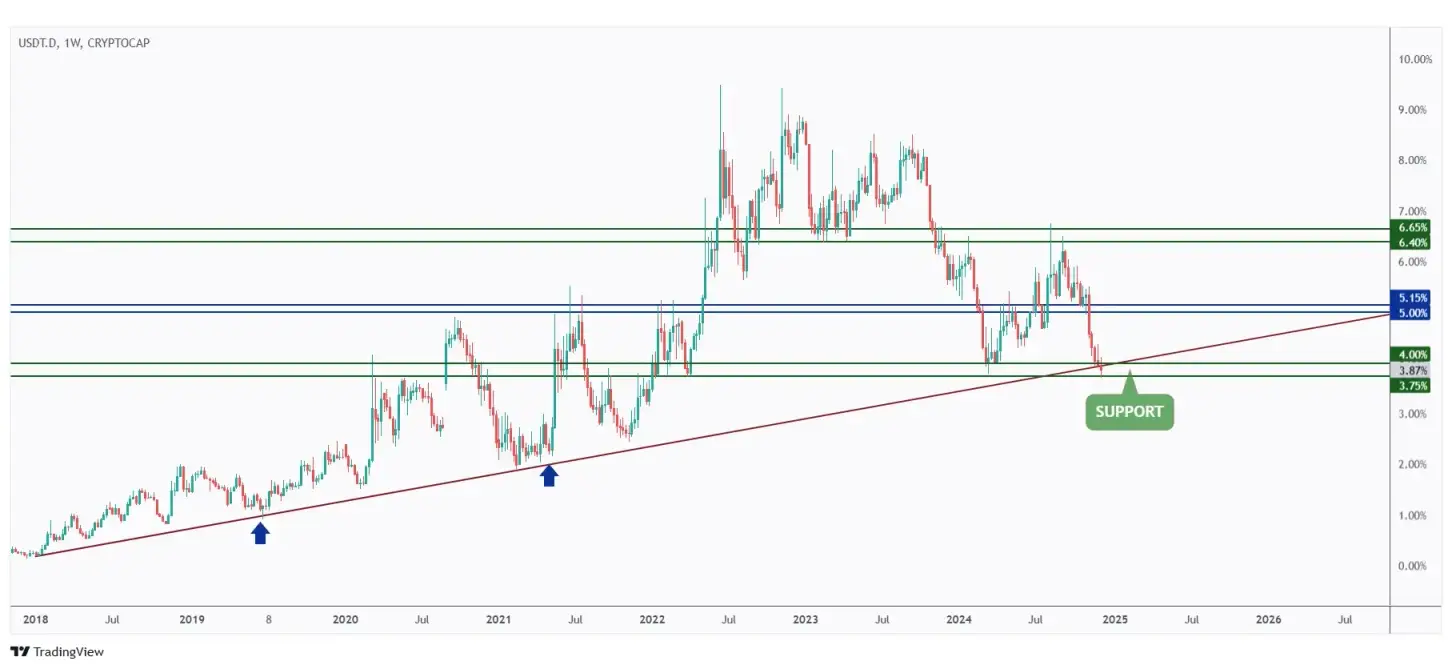
USDT.D is still around an interesting weekly macro support. The question is, will it reject or break it?
The answer will determine the next movement for the upcoming couple of weeks.
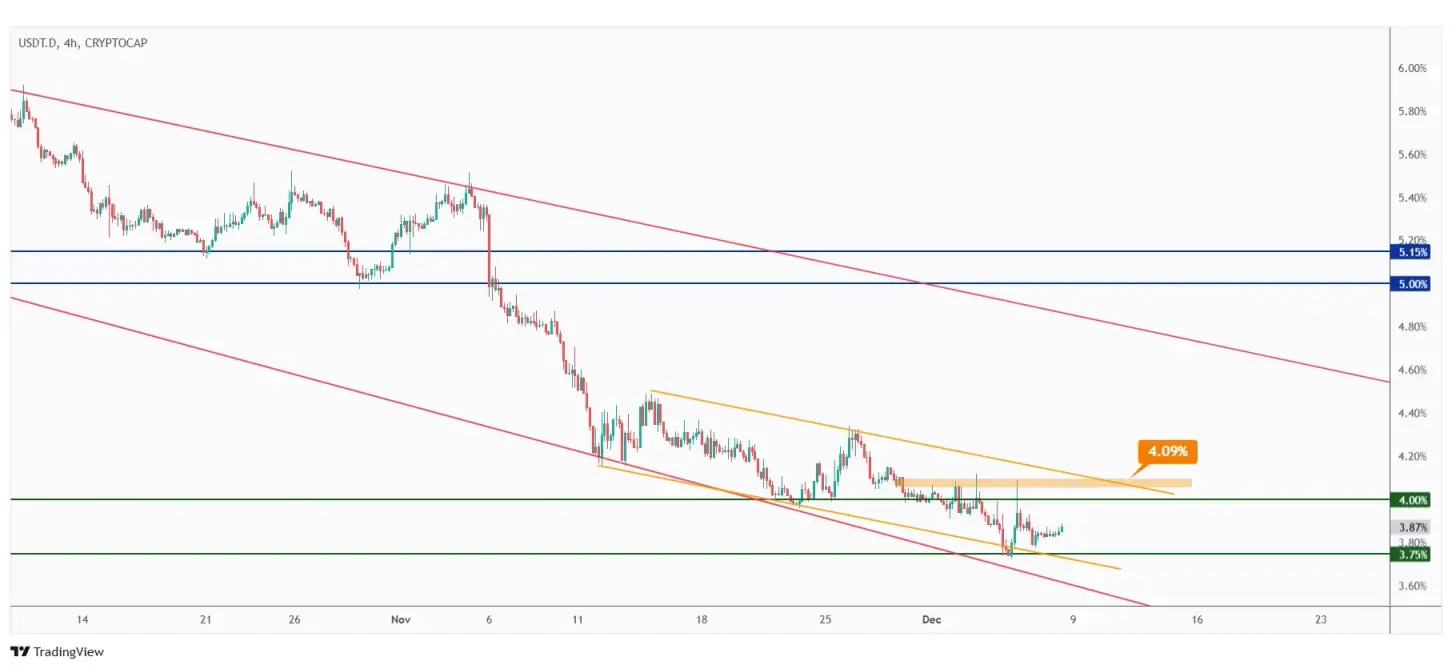
As mentioned in my last USDT.D update, it will remain bearish unless the 4.09% high and the orange channel are broken to the upside.
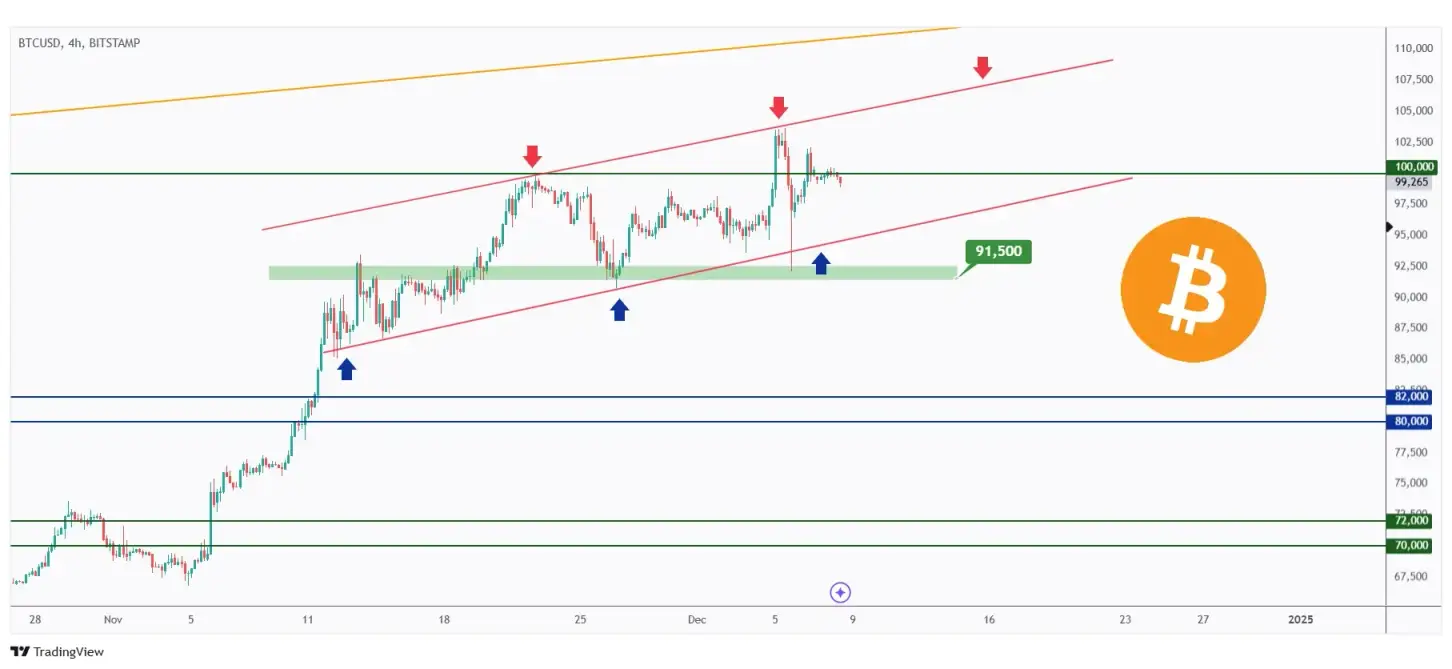
Bitcoin (BTC) is maintaining its position around the $100,000 mark.
Should it experience a decline, the next support level would be near the lower boundary of the red channel and the $95,000 round number.
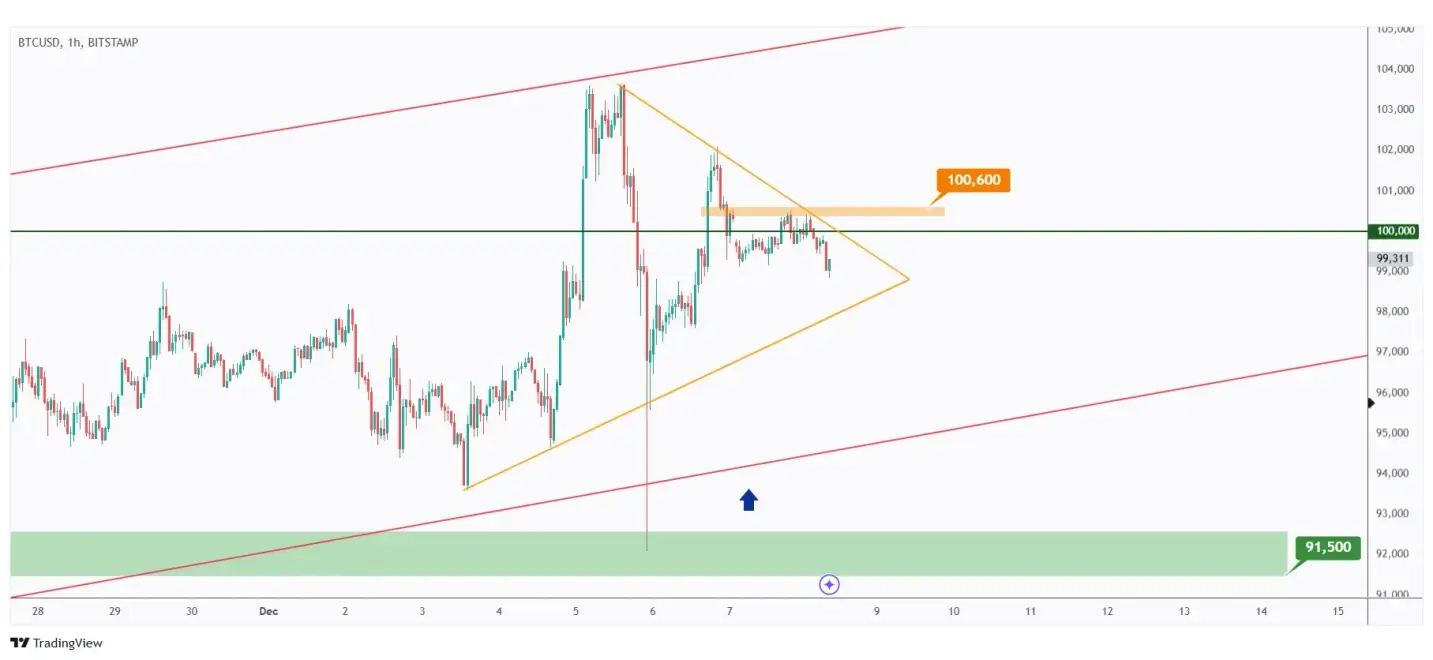
Short-term, BTC’s range is getting smaller and smaller, forming a symmetrical triangle.
The more time passes, the more likely it is that a breakout is approaching; that’s the nature of a symmetrical triangle.
If $100,600 is broken to the upside, the bulls will be ready to start a new impulse.
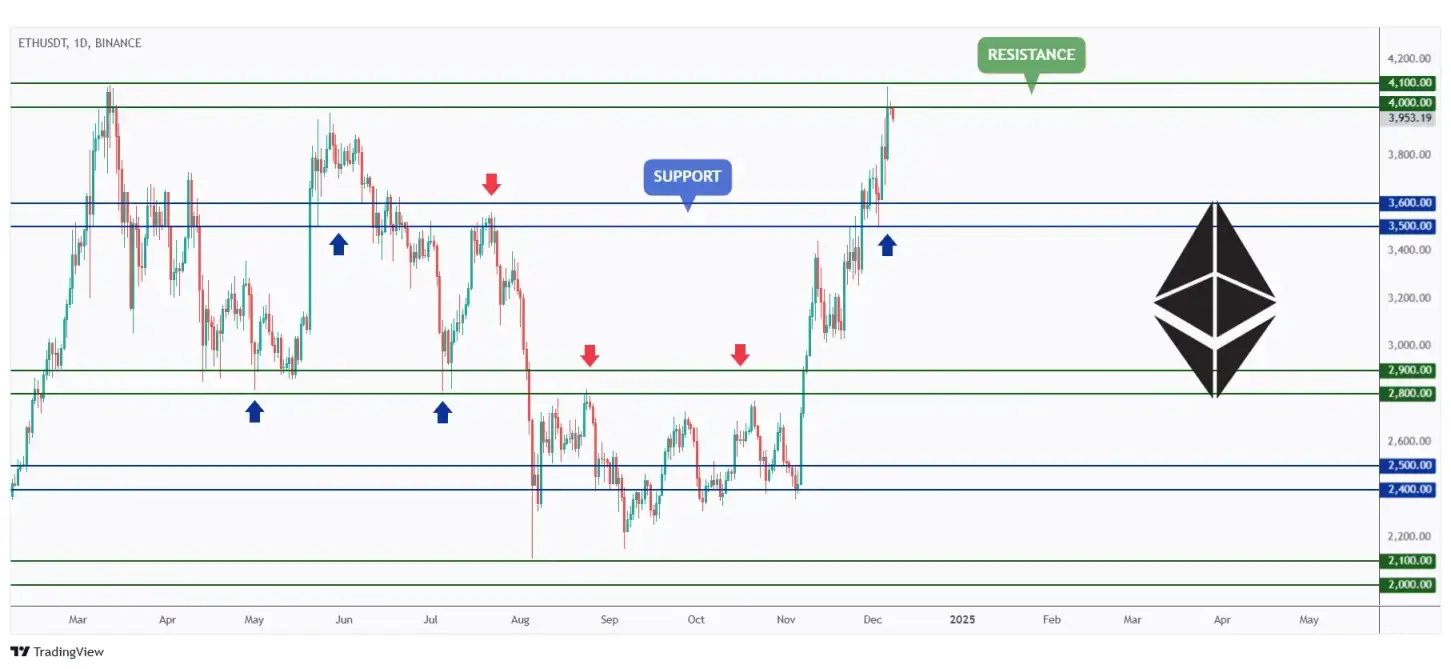
ETH is testing new levels not seen since July, with the $4,000–$4,100 range acting as a strong resistance.
A decisive break above this zone could expose the $5,000 target. Conversely, failure to surpass this resistance may provide bears an opportunity to initiate a correction.
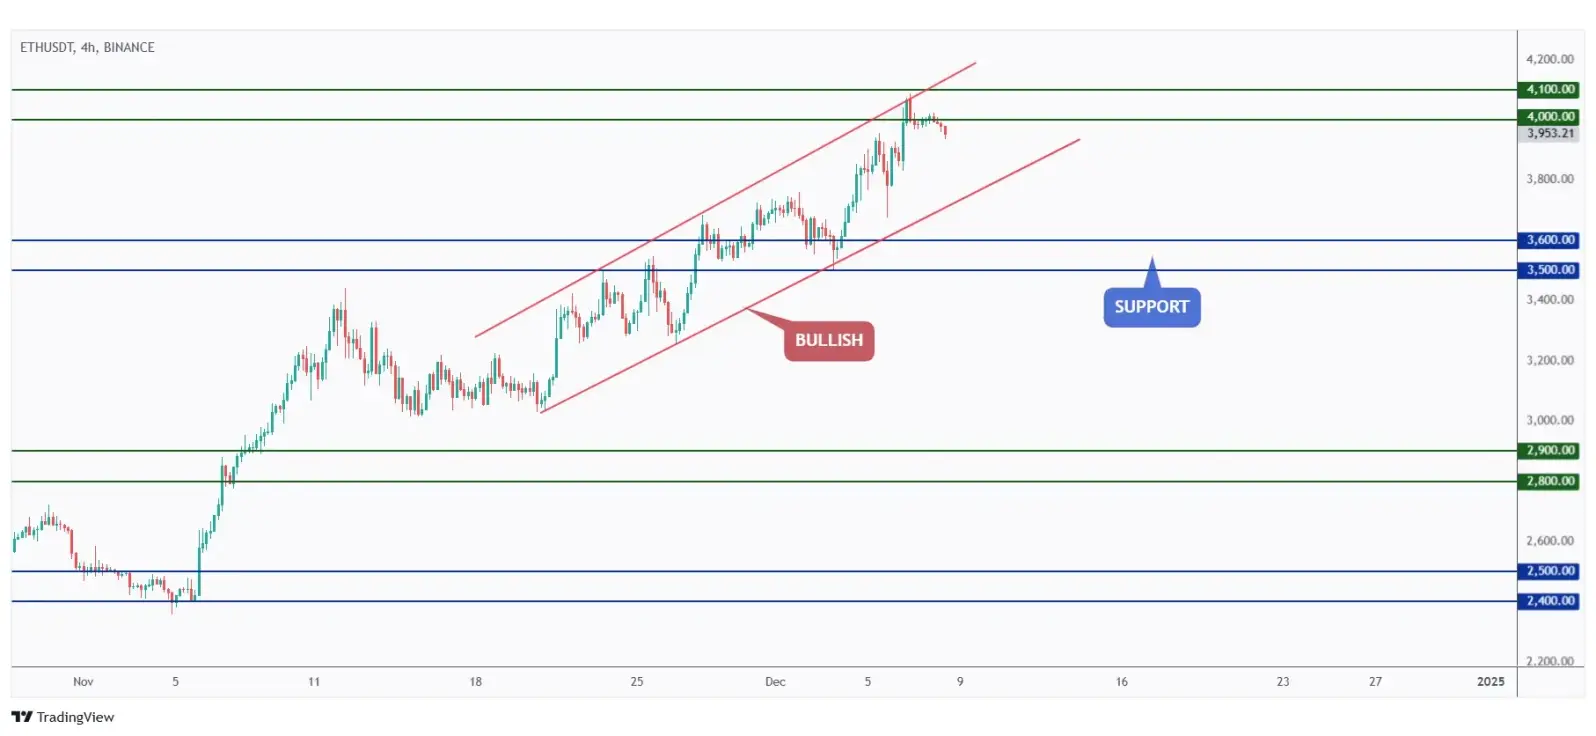
Medium-term, as ETH approaches the lower bound of the red channel, we will be looking for trend-following long positions.
Quotes / Advices
In investing, what is comfortable is rarely profitable.
~ Robert Arnott
Closing Remarks
In summary, Bitcoin has maintained its position near $100,000, forming a symmetrical triangle that hints at an imminent breakout.
Ethereum is testing resistance around $4,000–$4,100, with a potential move to $5,000 if the level is breached. Meanwhile, medium-term strategies focus on trend-following long positions near ETH’s lower channel boundary.
USDT.D is at a critical weekly macro support, the decision to either reject or break this level will determine market direction in the weeks ahead.
DXY is hovering near its range’s upper boundary and remains bearish in the short term.
Gold mirrors this volatility, trading within a narrow range, with bullish continuation dependent on breaking key resistance levels.
US500 remains bullish but is nearing overbought zones. Short-term trends suggest persistence in the rally unless key supports are breached.


